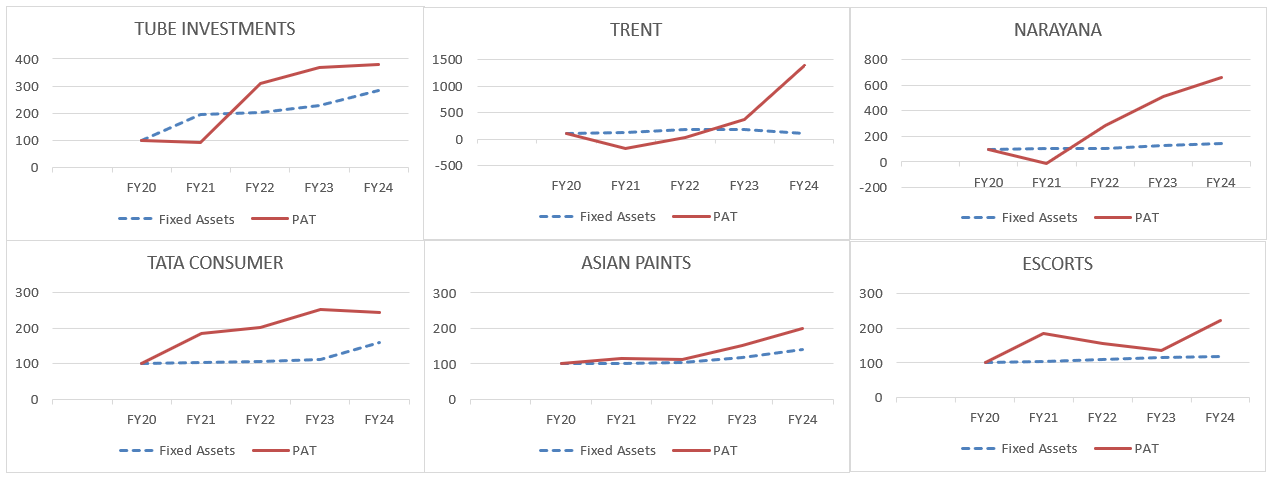
Capitalism without capital, i.e., the growing prominence of companies who are plays on intellectual rather than physical assets, is now increasingly prominent in India. Marcellus’ Consistent Compounder Portfolio (CCP) is actively participating in this theme. Over the past 5 years, profits of companies in our current CCP portfolio have grown at a significantly faster pace (31% PAT CAGR) compared to their fixed assets (16% Fixed Asset CAGR) on a weighted average basis. Cleverly constructed intangible or intellectual assets provide our investee companies advantages around: a) ‘Scale’ – e.g. Narayana’s tech stack; b) ‘Spillovers’ – e.g. Trent’s differentiated procurement architecture that was built for Westside, but was leveraged by Zudio; and c) ‘Synergies’ – e.g. CMS Infosystem’s multiple intangible assets collectively produce even higher returns than what they would produce individually. All of this drives cash flow generation, which is reinvested by the CCP companies to drive revenue growth

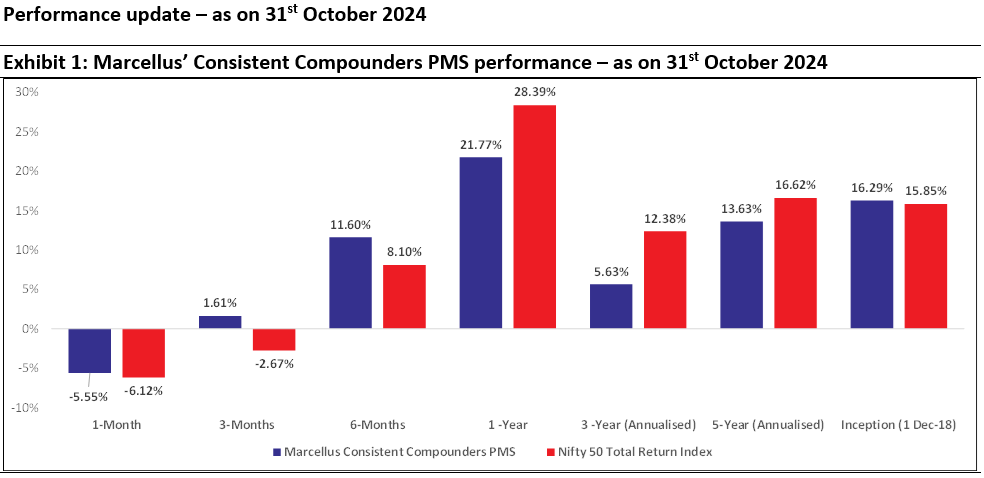
Source: Marcellus Investment Managers; Marcellus Performance Data shown is net of fixed fees and expenses charged till 30th Sept 2024 and is net of Performance fees charged for client accounts, whose account anniversary / performance calculation date falls upto the last date of this performance period; since inception & 3 years returns are annualized; other time period returns are absolute. Relative performance of particular Investment Approach to other Portfolio Managers within the selected strategy, please refer https://www.apmiindia.org/apmi/welcomeiaperformance.htm?action=PMSmenu . Under PMS Provider Name please select Marcellus Investment Managers Private Limited and select your Investment Approach Name for viewing the stated disclosure. The calculation or presentation of performance results in this publication has NOT been approved or reviewed by the SEC, SEBI or any other regulatory authority.
De-coupling of Capex growth and PAT growth In India over the last decade
In a recent blog (‘Capitalism Without Capital’ Finds Strength in India), we highlighted that in India today, capex in the traditional sense (or investment in tangible assets) does not translate into higher profit growth. Conversely, we pointed out that higher profit growth does not necessarily lead to higher investment in tangible assets. Across a database of 40,000 Indian companies from CMIE (see charts below):
1. Companies in the top decile by profits are NOT the ones that are able to grow their profits at the fastest pace. It is the companies in the second decile who have delivered the fastest profit growth.
2. Companies which have grown profits at the fastest rate (i.e. the second decile) are NOT the ones who have grown fixed assets at the fastest rate!

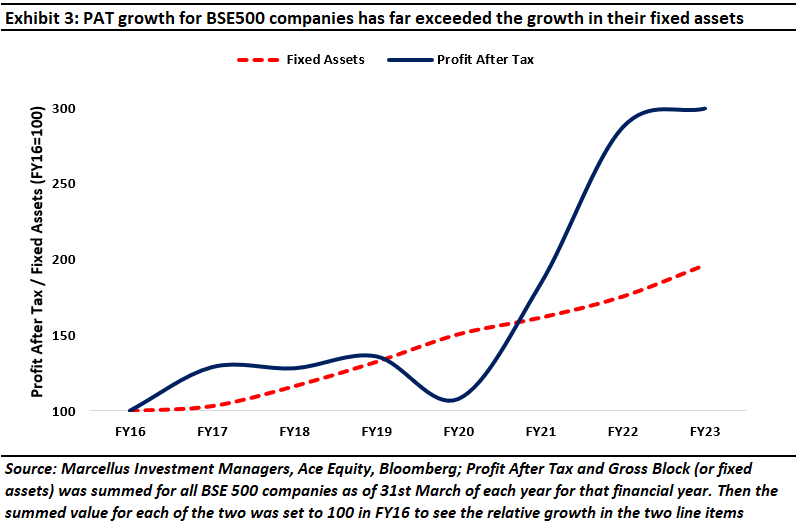
Consequently, even for the BSE500 universe of listed stocks, PAT growth for companies in the index has far exceeded the growth in their fixed assets – see chart below

This phenomenon has accelerated in the second half of the last decade (FY20-24) compared to the first half (FY14-19). A recent Business Standard article highlights that the combined net profit of listed non-Financials companies has witnessed a CAGR of 32.4% since FY20 (compared to 7.4% CAGR between FY14-19). On the other hand, the corresponding growth in corporate investment in fixed assets for the same set has grown at a CAGR of 8.6% during FY20-24, almost at the same level as the CAGR between FY14-19 of 8.5%.
Jonathan Haskel & Stian Westlake highlighted this line of thinking in their 2017 book “Capitalism Without Capital”. The central theme of the book is that corporate investments, in the past 40 years especially, have become increasingly intangible rather than tangible. Aggregating data for the developed world, the authors show that around the turn of the century, the developed economies started investing more in intangibles (which traditional accounting techniques do NOT capture as capex) and less in tangibles (like factories & machines). The pre-eminence of intangible investing according to the authors, have brought to the fore, four effects that intangible assets showcase:
These four effects are crucial for a company to become a consistent compounder because once a company scales using intangibles assets (such as a proprietary database), it can then extract spillovers from other companies’ investments in intangibles (such as a third party software platform like SAP), and then create synergies between intangible investments (the proprietary database feeds the SAP with big data) which can potentially help the company corner the entire industry. This essentially means that the incremental capex in intangibles that firms are undertaking is NOT getting recorded as capex yet has a powerful bearing on their profitability. These effects have played out even in the Indian context.
In India these four economic changes have been catalyzed through introduction of GST in 2017, massive build out of physical infrastructure like road & airport networks, incremental financialization of households’ savings, and the rise of low cost mobile broadband. What’s even more interesting is that these changes have occurred in India in the space of a decade and have helped create a cohort of well-managed, increasingly high-tech listed Indian companies which are investing heavily in intangible assets (R&D, networks, training, branding, databases, etc.).
Marcellus’ CCP is a play on ‘Capitalism Without Capital’
Over the long term, share price of any stock is strongly driven by / correlated with the underlying fundamentals of the business i.e. profit growth and efficiency of capital allocation. In Marcellus, we take a long term view of portfolio construction. Hence, since winners in India’s economy are increasingly defined by ‘Capitalism without Capital’, we have reflected this transition in portfolio changes implemented over the last 12 months.


‘Scale: intangibles are easily scalable to any length once developed initially’ e.g. NARAYANA’s tech stack
One of the key measures of a tertiary / quaternary care hospital’s efficiency is the average length of stay of a patient in the hospital. Shorter the length of stay, greater the asset turnover and hence cash generation for the hospital, because the run-rate of revenue from a patient is highest during the first couple of days of bed occupancy. However, the ability to reduce average length of stay for a hospital requires operational excellence in areas such as doctors spending more time doing tertiary treatments vs OPD consultations and follow-ups, efficient process flow during admission and discharge and several other such areas of operational excellence. NH has been able to convert many of the IPD treatments which require overnight stay into day-care procedures, far greater than that of its peers. As a result, NH generates healthy ROCE comparable to that of its peers despite its ‘average revenue per patient’ (ARPP) being 30%-50% lower than that of its peers.

- Efficiencies generated through the tech initiatives have been passed onto the patients through discounts offered on rack rates. Hence, average revenue per patient (ARPP) for Narayana is 35% lower than that of its peers – see table above. Lower ARPPs make the treatment affordable to a wider range of patients, helps build stronger rapport with insurance companies, and reduces the risk of regulatory intervention around capping of treatment costs in future.
- KYC of a patient is superior due to faster information retrieval i.e. Doctors, and the broader hospital is more aware of a patient, which helps enhance service levels and improve stickiness of the patient. This also helps the hospital retain revenues from ancillary services like pharmacy and diagnostics in-house, as it offers the patient an ability to use the entire NH ecosystem at one place, with various parts of the ecosystem seamlessly interacting with each other.
- NH is expanding a network of integrated clinics which offer OPDs, diagnostic and pharmacy close to home for the patient. This business model already exists for peers such as Apollo (Apollo Clinic, Apollo Pharmacy, Apollo Diagnostics). However, NH is unique in being able to operate through a common EMR (electronic medical records) and hence lock-in the consumer for repeat visits and cross selling.
‘Spillovers’: refers to the phenomena wherein a company that makes an investment in intangibles may not be the only one, or not even the one to reap its benefits fully later; they are more often than not reaped by others. TRENT’s construction of a differentiated procurement capability at Westside, which was monetised in a bigger way at Zudio (and hence also at Star Bazaar), is an example of a ‘spillover’.
At a very simplistic level, all retail formats of Trent (mainly Westside, Zudio and Star Bazaar) understand their customers better than their competitors and hence stock more relevant products in the stores. Consistently relevant and differentiated products = less dead stock = less discounted sales = high margins and high inventory turnover. Westside and Zudio derive more than 85% of their revenues from full priced sales vs ~60% average for their competitors. Store level ROCEs of Zudio and Westside are more than 30% each, and are hence head and shoulders above the ROCEs of all of their competitors in apparel retail. ROCEs of any retailer are a combination of margins and inventory turns i.e. how much money you make on a piece of apparel, and how many times you can make that margin by turning around your inventory at a faster rate. Westside beats its competitors both on margins (57% vs around 45% for its competitors) as well as on inventory turns (6x vs 3-4x for its competitors), while Zudio massively beats its competitors solely on inventory turns (10x vs 2x-4x for its competitors).
Secret sauce of Westside and Zudio? Intangible investments to build a unique architecture around buying teams (whose job is to understand the customer demand and decide about the price and design that can be sold in the store), designers and sourcing teams (which coordinates with the vendors who manufacture the product ). The architectural difference between Trent and its competitors is around which of these three teams is the power-centre or the biggest driver of merchandizing. For Trent’s competitors, sourcing teams are the power-centres i.e. the approach is “What can we supply to the customer basis what we are able to procure?”. At Westside and Zudio, ‘buying teams’ are the power centre i.e. the approach is “What does the customer want and at what price?”.
Spillovers effect of intangible investments – from Zara to Westside to Zudio to Star Bazaar. Design process at Trent was built basis global best practices brought by Phil Auld at Westside, over 10 years ago, and the learnings from Zara. Before Phil Auld came in, Westside was a Design led retailer, just like other apparel. Phil Auld changed the architecture to make it buyers led. Customer centricity was made the key tenet. Buyers, designers and sourcing teams at Westside were required to be on the payroll of the retailer under Phil Auld, so that there is exclusivity, control and focus on the decision-making of these teams. This architecture was then replicated at Zudio. Buyers at Trent are also forced to work on designing. This allows them to be able to procure lower quantity of more experimental designs. Buying small quantities for experimentation requires buyers to find more designs & conduct more negotiations which is operationally challenging. Why can’t other retailers copy this architecture? The toughest part is the mindset shift required. There is no difference in the type of designers Trent hires vs competitors – it is same set of people like those at ABFRL or Shoppers Stop. But the difference is in the way certain attributes of design are made part of process given the architecture explained above. Phil Auld would spend a lot of time on the floor himself, interacting with customers and this inspired other buying members also to spend time on the floor and interact with customers. One of the senior ex-employees of Trent told us – “ It is difficult to replicate the discipline which Trent’s CEO & Chairman have around product, discounting, marketing. People leaving Trent get influenced by the culture of these companies and hence while they may copy some part of Trent, but not the whole. One leader from Trent is not enough to change the mindset of middle management of ABFRL or SS.”
Spillover effects being enjoyed by Star Bazaar as well! Just like Westside and Zudio, Star Bazaar is also predominantly private label focused (73% private label) with backward integrated architecture of buyers and merchandise procurement. Globally players like Walmart (30% private label), Tesco (50% private label) and Aldi’s (90%+ private label) have shown that private label can work if product quality is at par or better at cheaper rates. Today, as much as 70% of Star Bazaar’s revenues are derived from its private label products, with less than 5% wastage during a day! And to top it all, every Star Bazaar has an attached Zudio offering to a supermarket customer, value fashion apparel superior to that offered by competing supermarkets – a direct spillover effect.
Synergies: multiple intangible assets may collectively produce even higher returns than what they would produce individually e.g. CMS INFOSYSTEMS
CMS is a business services company with leadership in cash management (~60% of the outsourced ATM in India are serviced by CMS), a growing presence in ATM managed services, retail cash management (cash transfer between organised retail stores and the bank) and now expanding into tech solutions (remote monitoring and software solutions). Banks are its customers across all types of services. CMS has built multiple intangible assets which improve the longevity of its customer relationships and increases exit barriers – thereby generating a 5 year EPS CAGR of 27% for CMS and its ROIC improving from 16% five years ago to 25% in FY24. These intangible assets are:
- Ability to manage compliance and logistics through operational excellence in an increasingly regulated environment. As a result, CMS enjoys strong relationship with the banks due to the reputation it has built over the years around reliability of operational excellence.
- Scale related advantages – Globally, winners in the cash management industry derive efficiency gains due to increase in route density. CMS has also improved its route productivity at ~8% CAGR over the last 4 years. It has been successful in developing one service for a bank & cross-sell it to other banks where marginal costs for deployment is very less.
- Ability to understand the pain-points of customers and build solutions around them with an aim of becoming a one-stop-solution for the bank. CMS started with ATM & retail cash management but soon ventured into the adjacencies like CIT vans, BLA, MSP, software solutions & remote monitoring – all of these were cross-sold to existing customers. A recent example – CMS is doing a pilot in collection as a service (to banks/NBFCs) and bullion logistics. Whilst there are regional players that exist in this space, there are NO pan India collections agencies. RBI has recently raised questions on collection practices of NBFCs (Mahindra finance was banned from using outside agencies for 6 months) and hence, there is need for a well governed and respected institution to do collections. There could be increased compliance burden here as collections agents deal directly with the customer and it is regulator’s agenda to make sure customers are treated fairly – however, that plays to CMS’s strengths. This regulatory push makes collections a scalable business case.
- Smart capital allocation decisions, including M&A: CMS’ management team has put capital to right use by doing small acquisitions in businesses related at ATM/cash management such that it is able to provide more solutions to its existing customer base which largely consists of banks. These new areas when entered were small experiments with very less deployment of capital & CMS was able to scale them up using strong management & operational capabilities. CMS’ management boasts of a payback period on acquisitions of not more than 3 years in any of its acquisition till date. For example, in 2017 CMS acquired the business of a small Brown Label ATM services company for Rs. 65 mn and has successfully scaled up that business to provide Brown Label ATM services for 3,120 ATMs as of March 31, 2021 (i.e. within four years). Similarly, in 2019, CMS entered the multi-vendor software solutions segment and are now a leading player for multi-vendor software to banks. Subsequently, CMS entered the remote monitoring segment in 2021 and have scaled it to 25,000 sites now with revenues close to ~Rs. 1.3 bn.
None of these intangible capabilities on a standalone basis would have built as deep and scalable moats for CMS, as they do collectively. Hence, its PAT CAGR of 27% over FY20-24 has been significantly higher than its fixed asset CAGR of 19% over the same period, helping improve its ROICs and cash generation.
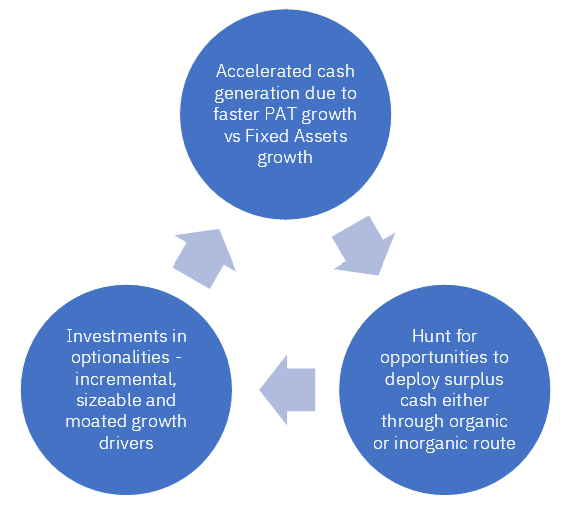
The flywheel effect: Stronger cash generation provides resources to fund multiple optionalities in future
Given the changes made to CCP over the past 15 months (click here for our newsletter highlighting the changes), several of our portfolio companies are implementing the flywheel effect as highlighted in the chart below:

Astral Poly is a good case study of how companies that deliver higher PAT growth vs fixed asset growth, create cash buffers which can be subsequently used to fund investments into several optionalities in future. Over FY09-14, Astral’s PAT CAGR at 48% was faster than its fixed asset CAGR of 31%. This helped fund the Resinova acquisition in FY15, which eventually again saw faster PAT growth (32% CAGR over F15-22) vs Fixed Assets growth (29% CAGR over F15-19, and this cycle kept getting repeated. As a result, Astral managed add several new lines of business and hence delivered at a consolidated PAT CAGR of 28% over the last 15 years.
Some of the largest allocations in CCP are towards companies which have narrowed down on the future business optionalities for incremental capital deployment and are building newer businesses to create the flywheel effect of ‘Capitalism without Capital’. For instance:
- Tube Investments is pursuing capital allocation towards building commercial-use electric vehicles (3-wheelers, trucks and tractors), pharma CDMO business for exports, optics / lens manufacturing, surgical sutures etc. Amongst these, electric three-wheelers by Tube (brand name: Montra) have already garnered and retained more than a quarter of the overall electric three-wheeler market share in the southern five states of India. Value generation from such optionalities is not at all baked into the current market price of Tube, if one does a sum of the parts valuation of the business, stripping out the current market cap ownership of Tube in CG Power, Shanthi Gears etc (assuming fair value of these businesses is not a small fraction of their current market cap).
- Narayana Hrudayalaya investments to build a network of integrated clinics, as highlighted previously in this newsletter, could disrupt the entire healthcare industry if it finds success in offering insurance cum healthcare under the same umbrella, thereby trying to address the conflict of interest (hospital incentivised to charge high rates from patients and insurance companies incentivised to reject insurance claims of patients) which currently works against patients seeking solutions to their health problems at hospitals across the country. Such value add is clearly not baked into the share price currently.
- Trent continues to incubate several new retail formats, some of which are targeted to scale up meaningfully in future – e.g. Star Bazaar, Zudio Beauty (erstwhile Misbu), Utsa, Samoh, Pome branded lab grown diamonds etc. We expect to capitalise on some of these optionalities through our allocation to such ‘enterprising compounder’ businesses in Marcellus’ CCP.
Regards
Team Marcellus


