Investing in a portfolio of value and cyclical stocks in India would have delivered comparable returns to portfolio of quality & consistently profitable companies respectively over longer term with value and cyclicals outperforming in the post-Covid period. However, an advantage of the quality style lies in its ability to delivers less volatile fundamental growth and returns across market regimes. MeritorQ’s diversified, quality centric investing approach is therefore a better alternative, as it avoids the need for market timing and allows investors to sleep more peacefully at night.
Portfolio Performance:
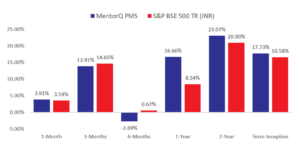
For Relative performance of particular Investment Approach to other Portfolio Managers within the selected strategy, please refer this link
Source: Marcellus Investment Managers. Note: (i) Portfolio inception date is November 15, 2022. (ii) Returns as of May 31, 2025. (iii) Performance data is net of fixed fees and expenses charged on a quarterly basis, the effect of the same has been incorporated up to March 31, 2025. Performance data is not verified either by Securities and Exchange Board of India or U.S. Securities and Exchange Commission. (iv) Total returns index considered for BSE500 above
In MeritorQ, both the screening and selection steps prioritize picking clean, profitable and well-run companies. Moreover, we aim to avoid deeply cyclical, commodity-based companies and sectors through the consistent profitability screen. Given this focus on quality and consistency in MeritorQ, it is worth comparing the performance of this quality investing style with its polar opposite- investing in value and cyclical stocks.
Value stocks are those which appear cheap on relative value measures like price to book, price to earnings, price to sales and price to dividends. We consider a composite of all these relative value measures to create the value portfolio referenced in the discussion below. Cyclical stocks are usually defined as those whose earnings are sensitive to GDP growth. For the purpose of this discussion, we consider variability of return of equity (ROE) over last 5 years to classify stocks into cyclical and consistent (consistently profitable) buckets every year. Because cyclical and value companies generally have higher fixed costs and hence higher operating leverage, generally there is considerable overlap between cyclical and value portfolios, though they are not exactly the same.
One of the features of the post Covid stock market rally has been the relative outperformance of cyclical and value stocks relative to more consistently profitable and quality stocks respectively. While cyclical and value stocks have seen strong earnings growth post-Covid aided partly by the topline recovery from lockdown (FY22-23), higher Government capex spend, and then from the commodity cool-off (FY23-24), one would expect more profitable, less cyclical businesses to fare much better over longer periods.
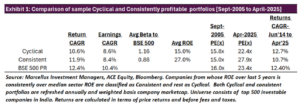
However, as Exhibit 1 shows, this is NOT the case. Annualized returns from investing in cyclical stocks have roughly been comparable to the more consistently profitable stock bucket between Sept-2005 to April-2025. In fact, cyclical stocks have done slightly better between June-2014 to April-2025 (i.e. under the current political dispensation).
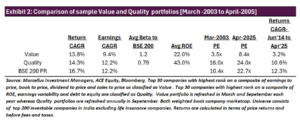
Consistency of profitability or stability can be considered one characteristic of quality. Considering a broader definition of quality stocks based on level of ROE, profit consistency and financial leverage, Exhibit 2 compares the performance of quality with traditionally defined “value” stocks both picked from among top 200 stocks by market cap. This definition of value and quality broadly aligns with methodology of investable value and quality factor indices available in India.
Similar to cyclical vs consistent portfolios shown in Exhibit 1, value and quality stocks seemed to have delivered roughly similar annualized returns from March-2003 to April-2025 (note that we are not considering any returns from reinvesting dividends in exhibit 2. Dividend payout generally tends to be higher for value stocks due to lower reinvestment), even if quality has done much better since June-2014.
Comparison across market cycles
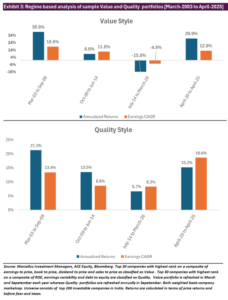
Point to point returns can be misleading. Exhibit 3 breaks up the full-period annualized returns and earnings CAGR in Exhibit 2, over distinct periods where clearly either Value or Quality were in favour. Choice of regime periods is based on a subjective judgement, for example, between 2003-2008 infrastructure and real estate companies witnessed sharp rally followed by outperformance of consumer and financials post 2008.
Firstly, as Exhibit 3 shows, value stocks outperformed quality stocks in two out of the four regime periods- Mar-2003 to Sept-2009 and April-2020 to April-2025 (post Covid). Secondly, performance of quality portfolio is steadier than the value, both in terms of realized returns and earnings growth across all the four regimes. Even though relative performance of each style varies across regimes, the steadier earnings growth of quality portfolio translates into steady returns for quality compared to value. For value investor, market timing becomes important as portfolio returns and earnings growth tend to be lumpier. For example, starting in September-2009 the value portfolio would have lost roughly 45% of starting wealth by March-2020.
Timing entry and exits from cyclical and value stocks might appear straightforward in hindsight but challenging to execute repeatedly in reality i.e. in real time. Even among the four regimes shown in Exhibit 3 above, there have been multiple mini cycles within each regime, where it was possible to switch in or out of value stocks either too early or too late.
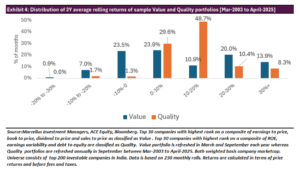
From an investor perspective, the steadier performance of the quality style reduces the risk of dramatically underperforming after entering the portfolio at the wrong time. The lower dispersion of returns for quality (vs value stocks) can be seen in Exhibit 4, which shows that value and quality portfolios have experienced negative 3Y annualized returns during 31% and 3% of the 230 month rolls during the analysis period stretching from March-2003 to April-2005. Multiple studies on investor returns, in India and globally, have shown that more volatile a fund’s performance, the wider the gap between actual investor returns (rupee weighted returns) and fund returns (time weighted returns).
In MeritorQ, stocks are selected in the final portfolio basis both quality and value (through Price/ Free Cash flow). Given that value and quality styles in India have seen low or negative correlation (refer to the January-2025 newsletter), returns of portfolio combining the two styles, can be expected to be as steady, if not steadier, than standalone quality as shown above.
MeritorQ’s repeatable, rules-based portfolio construction process combined with focus on quality, diversification and avoiding deeply cyclical companies, helps the strategy generate a steadier return profile without the need to necessarily change investment approach when market regimes change. Steadier performance encourages investors to stay invested and can help them better capture the strategy returns across market cycles without falling prey to emotions of greed and fear.
Regards,
Team Marcellus
If you want to read our other published material, please visit https://marcellus.in/


