
The NIFTY 50 is an Indian stock market index that represents the float-weighted average of 50 of the largest Indian companies listed on the National Stock Exchange.
The BSE 500 index is designed to be a broad representation of the Indian market. Consisting of the top 500 companies listed at BSE Ltd., the index covers all major industries in the Indian economy.
The S&P 500 is a Free-float weighted stock market index tracking the stock performance of 500 leading companies listed on stock exchanges in the United States.
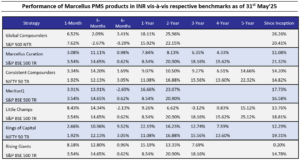
Note: For all strategies except GCP, Performance data shown is net of fixed fees and expenses charged till March 31st , 2025 and is net of annual performance fees (Except for Little Champs Portfolio) charged for client accounts whose account anniversary/performance calculation date falls up to the last date of this performance period. Since, for Little Champs Portfolio, performances fees are charged on cumulative gains at the third anniversary, of the respective client account, the effect of the same has been incorporated for client accounts whose third account anniversary falls up to the last date of this performance period. Performance data is not verified either by Securities and Exchange Board of India, IFSCA or U.S. Securities and Exchange Commission.
For GCP, performance data is shown gross of taxes and net of fees & expenses charged till end of last month on client account. Returns more than 1 year are annualized. Performance is the combined performance of our RI and NRI strategies. GCP USD returns are converted into INR using exchange rate published by RBI. Source: https://www.rbi.org.in/scripts/ReferenceRateArchive.aspx
*For relative performance of particular Investment Approach to other Portfolio Managers within the selected strategy, please refer https://www.apmiindia.org/apmi/WSIAConsolidateReport.htm?action=showReportMenu Under PMS Provider Name please select Marcellus Investment Managers Private Limited and select your Investment Approach Name for viewing the stated disclosure.
Note: APMI provides performance data of Portfolio Managers managing domestic strategies only. Hence, GCP is excluded.
Consistent Compounders Portfolio (CCP)
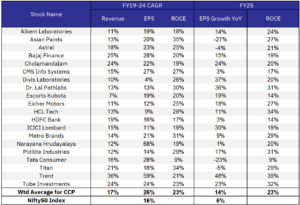
During FY25, Marcellus’ current CCP portfolio constituents delivered a weighted average EPS growth of 14% YoY, compared to Nifty50’s EPS growth of 6% YoY over the same period.
Looking forward towards FY26 and beyond, we expect to see an interplay of the following factors for the CCP portfolio:
· Opportunities: Widening of gap between companies with high quality fundamentals, vs the rest of the sector : During periods when Nifty50’s earnings growth is weak, companies with high quality of moats and capital allocation prudence outshine vs the broader market. We expect such a phase of the broader market to persist over the next few years. Marcellus’ CCP portfolio consists of companies with: a) deep moats reflected in their high ROCEs (23% in FY25 and over FY19-24); b) strong balance sheets funding capital allocation initiatives; and c) high quality management teams driving deepening of their existing moats and prudence in capital allocation decisions. Hence we expect our portfolio companies to gain market shares in their respective industries and add new revenue growth drivers to their businesses.
· Risks: Navigating through risks around high valuations, potential disruptions and geopolitical macro headwinds : Given the current rich levels of valuations across several sectors, particularly for good quality businesses, we intend to consistently use our position sizing and stock selection tools to find opportunities around positive earnings surprises vs expectations, and reduce the risk of valuation compression in our portfolio holdings. As highlighted in our last month’s portfolio update, CCP’s forward P/E multiple today is at ~ 25% discount to its last six year average, thanks to the changes we made to the portfolio constituents in 2024. The 1 year forward P/E multiple of our portfolio is near its lowest point since inception of CCP thanks to these changes. We also see risks around radical disruption of several industries and intend to use our bottom-up stock selection frameworks to help stay invested with companies that are driving such disruptions rather than those who are at risk of getting disrupted. Finally, when it comes to geopolitical headwinds, while it is difficult to predict such events, a large part of our portfolio is exposed to companies which sell essential goods and services in a manner which does not expose them meaningfully to geo-political risk factors.
Marcellus Curation Portfolio (MCP)
The MCP portfolio delivered 13% weighted average EPS growth during FY25 vs. 12% for the BSE500. The broader corporate earnings slowdown of the previous three quarters continued in Q4FY25 as well. FY26 Consensus EPS estimates for the BSE500 index saw a further downward revision by 7% between Dec, 2024 and May, 2025. The BSE500 index EPS growth is likely to be 8% in FY26 as per current consensus estimates. Historically, consensus numbers have been revised downwards as the year progresses and therefore a year of mid-single digit EPS growth for the broader index could be a possibility.
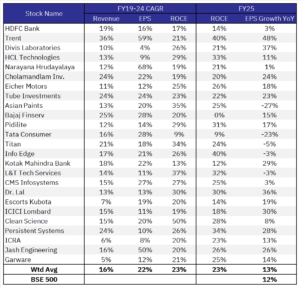
We have therefore stayed true to our style of investing in quality and growth-oriented companies with the portfolio’s RoCE at 23% and Earnings growth at 13%, both which are higher than the index. We continue to monitor valuations, and our attempt has been to upgrade the portfolio quality as and when valuations in certain companies which meet our parameters gets attractive. Similarly, we have been proactive in trimming and exiting stocks where valuations have become expensive.
Global Compounders (GCP)
May was a relatively calm yet constructive month, with both the GCP portfolio and broader markets posting returns of over 5%. Sentiment was initially buoyed by headline-driven optimism around tariff negotiations, followed by stronger-than-expected hard data—particularly US job creation figures. While we don’t attempt to forecast macro-outcomes, our focus remains on identifying businesses with a reasonable margin of safety and long-term resilience.
Earnings and Developments
We saw a mix of earnings surprises—Heico turned in a great quarter whereas Copart was a bit disappointing. We definitely track the short-term movements – but in both the cases we felt there is not much change in their long-term stories. More notable, however, were significant events at UnitedHealth Group and Berkshire Hathaway:
UnitedHealth saw a sharp stock price decline amid concerns about risk underwriting, following a CEO change. We initiated a small position a few months ago and view this correction as a potential opportunity. Importantly, former CEO Stephen Hemsley, who played a pivotal role in UnitedHealth’s success, has returned. Early feedback from our channel checks on this change has been encouraging.
Berkshire Hathaway marked the end of an era, with Warren Buffett formally announcing his retirement as CEO after an extraordinary 60-year tenure. His successor, Greg Abel, will take over as planned. From 1965 to 2025, Berkshire compounded at nearly double the rate of the broader market—turning a $100 investment into ~$4.5 million. Berkshire has been a core GCP holding since inception, and it has more than delivered.
Portfolio Adjustments
Changes were minimal this month. April’s volatility expanded our opportunity set, and in the PMS, we exited Lululemon in favor of LVMH. While we continue to like Lululemon’s fundamentals, we believe LVMH offers a more attractive bargain at current valuations.
Why LVMH?
LVMH’s edge lies in its scale and unwavering focus on quality, creativity, and exclusivity—the core ingredients of enduring luxury. Under Bernard Arnault, the firm has mastered the art of acquiring and revitalizing iconic brands (Bulgari, Dior, Tiffany), without compromising creative freedom.
At scale, LVMH still manages to maintain operating discipline, access top-tier resources (raw materials, talent, real estate), and communicate its brand narrative effectively.
· Through-cycle returns: ~13% (EPS growth ~11% + 2% dividend)
· Down-cycle returns: ~9%
· FY24 organic growth: +1% — the lowest in 23 years outside GFC/COVID
· Valuation: <10x EV/EBITDA (blended 24m fwd), lowest in 7–8 years
Consensus expectations for Mid Single Digit sales and High Single Digit–Low Double Digit EPS growth over the next two years seem reasonable. At current levels, much of the China pessimism appears priced in, while moderate US softness is unlikely to materially hurt numbers. Unless one believes the business is structurally impaired, LVMH offers a rare opportunity to enter a best-in-class franchise at the lower end of its historical valuation range.
In short, LVMH has historically doubled earnings every ~6 years. Conservatively factoring in scale, we assume a 7-year doubling—implying a ~10% CAGR. By this lens, the current valuation reflects earnings below mid-cycle levels, giving us comfort on both downside protection and upside potential.
Staying Disciplined Amid Pockets of Excess
We continue to see parts of the market—especially certain high-growth tech names and select consumer staples—where valuations seem difficult to justify relative to long-term return expectations. We’re navigating these areas with caution, maintaining discipline and only allocating capital where we see a meaningful margin of safety.
As always, we remain focused on owning high-quality businesses that can compound capital through cycles, while keeping a close eye on valuations.
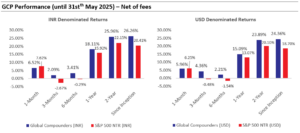
Marcellus performance data shown is gross of taxes and net of fees and expenses charged until the end of last month. Performance fees are charged annually in December. Returns for periods longer than one year are annualized. Marcellus’ GCP USD returns are converted into INR using exchange rate published by RBI. Source: https://www.rbi.org.in/scripts/ReferenceRateArchive.aspx
Since Inception’ performance calculated from 31st Oct 2022. The inception date is 31st October 2022, being the next business day after the account got funded on 28th October 2022. S&P 500 net total return is calculated by considering both capital appreciation and dividend payouts.
The calculation or presentation of performance results in this publication has NOT been approved or reviewed by the IFSCA or SEC. Performance is the combined performance of RI and NRI strategies.
The difference in performance in INR and USD is because of USD/INR currency appreciation/depreciation for the month.
Kings of Capital Portfolio (KCP)
KCP NAV rose 2.66% in May outperforming the Nifty 50 TRI (1.92%) and Nifty Bank TRI (1.37%). KCP has also demonstrated strong medium-term performance, outperforming Bank Nifty over the past 12 and 24 months, particularly as the initial euphoria and investor interest in public sector banks and tier-II private banks have subsided. Furthermore, KCP’s one-year performance ranks in the top quartile when compared with mutual funds focused on the BFSI sector. Source: Value Research
During FY25, Marcellus’ current KCP portfolio constituents delivered a weighted average EPS growth of 17% YoY, compared to Nifty50’s EPS growth of 6% YoY over the same period. This substantial delta in EPS growth (compared to the benchmark), coupled with reasonable valuations, were the primary drivers of KCP’s outperformance. While loan growth in FY23-24 was broad-based and faster across products, it became slower and narrower in FY25. Looking ahead, the outlook for growth remains soft, with the banking sector’s growth expected to hover around 10-11%. In this context, lenders that can prudently gain market share and grow faster are likely to command premium valuations.
Despite weak economic growth, asset quality in the sector has held up well across major product categories and stress areas remain the old known categories like MFI, unsecured personal loans and 2Ws. Although there was growing concern about delinquencies in the unsecured retail segments potentially spreading to other areas over the past two quarters, overall stress formation for the system remains limited. Early indicators from the past two quarters suggest that the worst of the asset quality challenges, even in the MFI sector, appear to be behind us, positioning the space for a cyclical recovery.
Meanwhile, the regulator (RBI) seems to be actively supporting growth. They have cumulatively slashed repo rates by 100 basis points YTD and have indicated a glide path for a 100-bps reduction in the CRR – both measures are supportive of loan growth and a reduction in interest burden for borrowers. Some of these policy actions are likely to result in a temporary dip in the margin profiles of Indian banks; we anticipate 2-3 quarters of sharp margin decline, which should begin recovering in the latter part of FY26 and FY27. NBFCs, on the other hand, should experience some margin tailwinds in FY26.
We continue to adjust our position sizing based on the evolving regulatory and economic environment. Our current cash levels are higher than normal, as valuations are not cheap.
Little Champs portfolio (LCP) and Rising Giants portfolio (RGP)
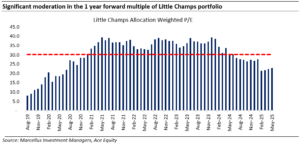
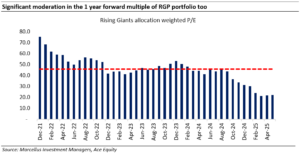
For 4QFY25, the Little Champs PMS portfolio recorded allocation weighted earnings growth of 17% YoY. The portfolio has witnessed double-digit recovery in earnings since 2QFY25. Similarly, the RGP’s allocation weighted earnings growth is holding up in double digits (15% YoY in 4QFY25).
The key drivers of the double-digit earnings growth in the LCP portfolio in the recent quarters continue to be:
- Most Exports oriented companies in the LCP portfolio recorded double-digit earnings growth in 3QFY25; and
- Rural oriented stocks (such as Dodla Dairy, Godrej Agrovet) exhibiting resilience in earnings growth.
Furthermore, as highlighted in the previous newsletters, the valuation multiples for both LCP and RGP portfolios have come down sharply from the highs of the previous periods as visible in the exhibits below. This has been through both being disciplined about the valuations and increase in cash allocation in the portfolios.
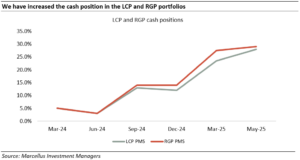
Increasing cash position in the current environment to mitigate the likely drawdowns in the small-mid cap space
Given our concern around the small-mid caps valuation in general together with deceleration in the earnings and further – we do anticipate further correction in the space.
In this context, we have increased the cash positions in both the LCP and RGP strategies. This we have been doing through the year as shown in the below exhibit
Having cash, we think, will help us in the following ways:
- Past precedents show that good quality stocks do fall during periods of market slowdown – hence cash will give some mitigation against these falls.
- Secondly, we will also get an opportunity to nibble into good quality stocks which can stage a strong comeback once the dust settles. This could be both increasing the position in the existing stocks which see unwarranted correction + getting into coverage stocks but which we had not invested earlier due to want of better entry price.
We are keeping a close watch on the developments on a continous basis to see if we need to adjust the cash positions.
Regards,
Team Marcellus
If you want to read our other published material, please visit https://marcellus.in/insights?filter
Please refer to the following link for our Responsible Investing Policy, our ESG Integration Framework and results of ESG scoring: https://marcellus.in/responsible-investing

