
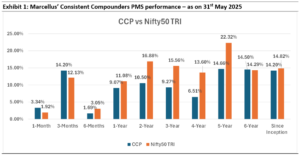
Nifty50’s EPS growth moderated to 6% YOY in FY25 (from 24% CAGR over FY21-24) whilst valuations remain elevated (21x FY26 P/E for Nifty50). In stark contrast, Marcellus’ CCP portfolio’s earnings growth rate has been in the range of 17%-18% CAGR until FY24 and held firm at 14% YoY in FY25. Amidst a growing earnings growth gap between the Nifty vs CCP, we expect CCP to benefit* from: a) focus on deeply moated companies with better quality management teams reallocating cash generated from better ROCEs towards driving market share gains, better profit margins, lower working capital cycles and better asset turns; b) potential for earnings upgrades for our investee firms; and c) an approach towards valuations looking to find underappreciated elements of quality (which provide low entry valuations). Key risks to our expectations include significant incremental deterioration in the macro demand environment and a broad-based economic growth recovery, akin to the FY21-24 period.
* These projections are based on our current assumptions, actual outcomes may be different
Source: Marcellus Investment Managers; Marcellus Performance Data shown is net of fixed fees and expenses charged till 31st Mar 2025 and is net of Performance fees charged for client accounts, whose account anniversary / performance calculation date falls upto the last date of this performance period; returns above the time period of 1 year are annualized; other time period returns are absolute. For relative performance of particular Investment Approach to other Portfolio Managers within the selected strategy, please refer https://www.apmiindia.org/apmi/welcomeiaperformance.htm?action=PMSmenu, Under PMS Provider Name please select Marcellus Investment Managers Private Limited and select your Investment Approach Name for viewing the stated disclosure. The calculation or presentation of performance results in this publication has NOT been approved or reviewed by the SEC, SEBI or any other regulatory authority.
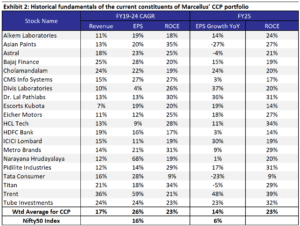
CCP’s current portfolio has delivered EPS growth of 14% in FY25 compared to 6% for Nifty50
During FY25, Marcellus’ current CCP portfolio constituents delivered a weighted average EPS growth of 14% YoY, compared to Nifty50’s EPS growth of 6% YoY (see table below). Key factors which compressed earnings growth in FY25 for the CCP included a weak macro demand environment for consumption in general (same store sales growth of Trent, Metro Brands) and for home building materials in particular (Asian Paints and Astral); high competitive intensity (e.g. Asian Paints and CMS Info); supply side shortages (e.g. Metro Brands) and massive commodity price inflation (e.g. Tata Consumer in Tea).
Factors which supported EPS growth for the CCP included market share gains due to strong moats alongside gutsy capital allocation decisions taken over the past few years by our investee firms (e.g. Narayana investing in tech and in their new Cayman hospital, Chola investing in new business lines beyond vehicle financing, Divis investing in building capabilities in new categories like contrast media and peptide building blocks (e.g. GLP-1), Eicher investing in product development for both domestic as well as exports market (bikes as well as Volvo trucks), Pidilite investing in products like Roff, Jowat and Araldite); and operating efficiency gains from tech investments and process improvements (e.g. Trent, Divis, Dr. Lal, Metro Brands)
Source: Companies, Bloomberg, Broker reports
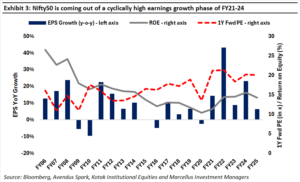
When it comes to earnings growth for the Nifty50 Index, FY25 was very different from the three-year period of FY21-24. The FY21-24 period saw the post-Covid revenge spending and the Government’s infrastructure capex drive a broad-based economic growth recovery. As shown in the chart below, over FY21-24, the Nifty50’s EPS growth was as high as 24% CAGR compared to its last 20-year (FY05-25) average of 10% CAGR. As revenge spending and the Government’s infra capex growth fizzled away in FY25, the growth environment reverted to the more sedate levels we had last seen between FY13 and FY19. In this subdued environment, the Nifty50’s earnings growth moderated to 6% in FY25.
As we look forward to the next few years, there are several risks that we need to look out for with respect to equity investments in India, such as – a) high valuations (21.2x FY26P/E for Nifty50 currently vs an average of 16.5x for the last 20 years); b) moderation in growth of Government capital expenditure compared to the elevated run-rate that prevailed over FY21-24; c) geopolitical risks creating supply side as well as demand disruptions for various industries; d) weaker growth in consumption oriented businesses in India compared to what has existed for the best part of the last two decades; and e) the heightened pace of disruption of incumbent business models due to an improved physical and digital infrastructure helping disruptors scale quickly; etc.
How do we see Marcellus’ CCP portfolio positioned amidst these risks?
We expect the gap between the ‘boys’ in the Nifty vs the ‘men’ in CCP to widen going forward, similar to how the historical experience has been (Over the last 20 years, Nifty200 Quality 30 TR Index has delivered 18.2% CAGR vs 14.6% CAGR for both Nifty50 TR Index and for Nifty 200 TR Index).
As earnings growth for the broader markets moderates in the absence of strong macro-tailwinds, we expect a wider gap in the profit and cashflow growth rates of Nifty vs the CCP. This is expected to be achieved through a combination of market share gains due to better competitive advantages1 (moats); and high reinvestment rate of their profits to drive radical disruption and add new growth drivers for the business.
Marcellus’ CCP portfolio continues to focus on bottom-up research to build a concentrated portfolio of deeply moated companies where we are clearly able to understand the sustainability of their sources of competitive advantages. These companies are run by management teams who not only maintain better standards of governance, but also drive prudent capital allocation decisions in a construct (board, CXO layers, succession, systems and processes) that is sustainable over the long-term future. The outcome of a deeply moated businesses run by better quality management teams is expected to be a combination of healthy ROCEs and high reinvestment rates of cash flows, thereby augmenting future growth drivers by deepening of existing moats and through the addition of new growth drivers. Such attributes are expected to contribute favourably to Marcellus’ CCP portfolio performance in a macro environment with modest profit growth for the broader economy.
We also believe that portfolio concentration is particularly advantageous in a weak growth environment (because in such an environment, there are likely to be fewer firms growing profits at a rate of mid-teens or higher). Having said that, incorporating the learnings from the last few years, we intend to mitigate the risks related to a concentrated portfolio through our hunt for non-correlated risks around the drivers of fundamental growth of the portfolio constituents.
Navigating through valuation risks in the current stock market is important. In an ideal scenario of valuations, we would like to invest only in better quality companies with healthy expected earnings growth, that also trade at low valuation multiples (e.g. Narayana Hrudayalaya, when it was added to the portfolio in early 2024). We have built part of our portfolio with such stocks. However, the longer the post-Covid bull market grinds on, the harder it becomes to find such stocks.
Hence, we have supplemented such stocks with ones where even though valuation multiples do not apparently represent lack-of-discovery, but the market’s expected profit growth for them offers opportunities of positive surprise and hence earnings upgrade in future (e.g. Trent, when it was added to the portfolio in Aug’23). In our view, the latter type of stocks are undervalued due to the market’s underappreciation of their earnings growth potential.
For example, with respect to Trent, we believe that the broader market underestimates its earnings growth potential around: a) benefits from Trent’s initiatives around cost savings (e.g. employee count per store) through upgrades to systems and processes across Westside / Zudio / Star Bazaar; b) potential for store count expansion of Star Bazaar as a format which adds significant value to customers through its vertically integrated fresh fruits and vegetables, private label substitutes to branded FMCG and superiority of its GM&A offering (Zudio for Apparel and pvt label Smartle for general merchandise) vs other brick and mortar peers; and c) possibility of success in some of the many pilot projects like new formats (e.g. Samoh / Zudio Beauty) or new merchandise (e.g. lab-grown-diamonds) – source: Trent’s FY25 Annual Report.
Hence, as highlighted in our May 2024 portfolio update , CCP’s forward P/E multiple today is at ~25% discount to its last six year average, and is also near its lowest point since inception. Comparison of CCP’s forward P/E multiple (42x FY26) relative to that of a benchmark index like Nifty50 is also a reflection of the ROCE (over twice that of Nifty50) and earnings growth (1.8x-2.0x of Nifty50’s earnings growth) of our portfolio constituents relative to the benchmark index.
The bulk of CCP’s performance is driven by the weighted average profit growth of the portfolio constituents (or rather changes in the market’s expectation of their profit growth). Such profit growth is a product of their cash generation (i.e. return on capital employed, ROCE of 23%-25%) and reinvestment of 80%-90% of their operating cash flows through capital allocation initiatives to drive profit growth (profit growth = ROCE x % of profits reinvested).
Finally, when it comes to managing various risks highlighted above, our approach towards position sizing in the portfolio incorporates an attempt to benefit from opportunities and reduce exposure to risks around: a) high valuations; b) probability and quantum of upgrades to market’s earnings growth expectations from specific stocks; and c) quality of moats, capital allocation and management team of the respective portfolio constituents.
Regards
Team Marcellus
If you want to read our other published material, please visit https://marcellus.in/
The mentioned stocks form part of Marcellus portfolio thus Marcellus clients, Marcellus employees and their immediate relatives may have interest in. The described stocks are for illustration & education purpose only and not recommendatory.

