
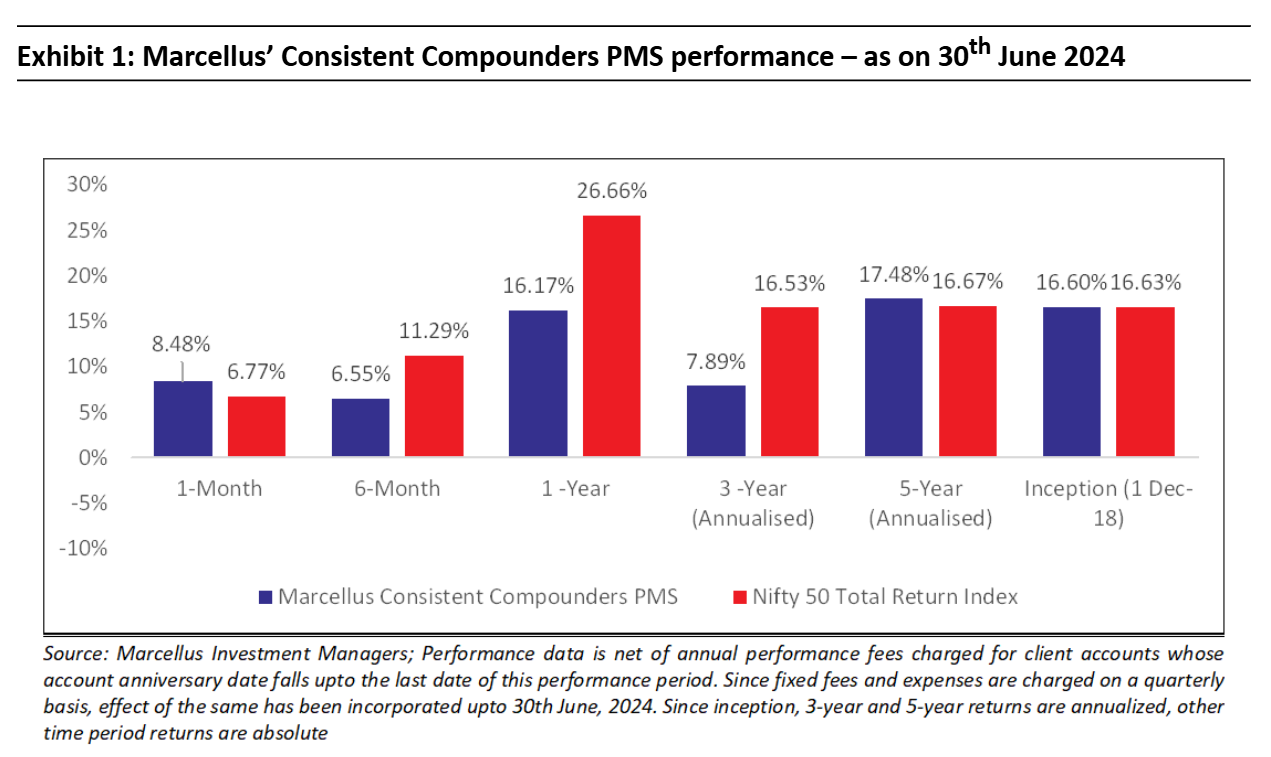
Businesses with strong competitive advantages (and hence high ROCEs), can be categorized into different types based on their capital allocation decisions. Amongst these, the most enterprising ones (the ‘enterprising compounders’) are those which reinvest capital not only to strengthen and evolve their core business, but also to scale up new businesses consistently. Shareholder returns from such businesses benefit from: a) higher rate of earnings growth; b) discovery of optionalities baked into the incubated businesses; and c) the longevity of the overall firm. Over the last 12 months, Marcellus’ CCP has invested more than 50% of its capital in such firms (e.g. Tube, Trent). CCP continues to deliver healthy and consistent fundamentals, significantly superior to the Nifty50. With CCP’s valuation premium to the Nifty50 at a five year low, a catchup of share prices of the investee companies with their fundamentals is underway.
“Over the long term, stock returns will be determined largely by which capital allocation decisions the CEO makes. Two companies with identical operating results and different approaches to allocating capital will derive two very different long-term outcomes for shareholders.” – Mark Leonard, founder and CEO of Constellation Software.
Three phases of Marcellus’ CCP journey since inception
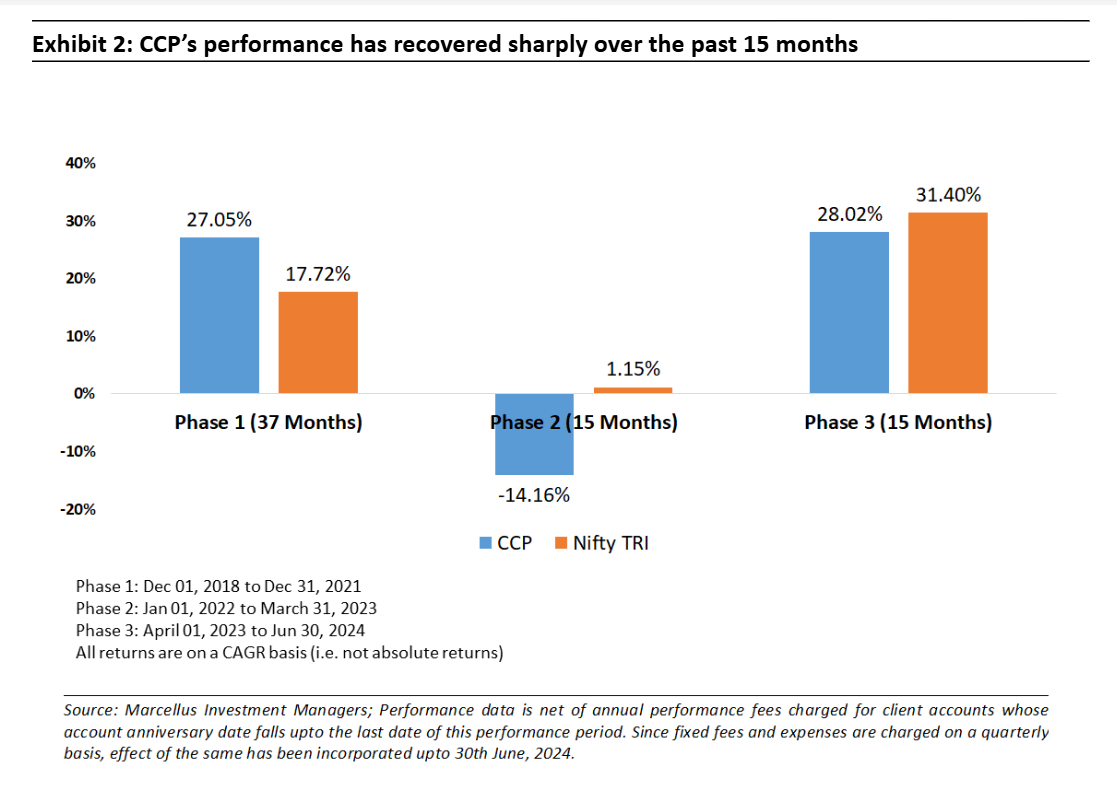
Marcellus’ CCP has had three distinct phases of portfolio performance since inception – first three years of 27% annualized returns, followed by 15 painful months which saw a 14% annualized drawdown. This in turn was followed by the most recent 15 months of 28% annualized returns. Recovery in the portfolio performance over the last 15 months has been supported by portfolio changes which have fired up both the expected earnings growth rates of the portfolio constituents, as well as the degree of undervaluation of optionalities incubated by ‘enterprising compounders’ i.e. companies with capital reinvestment rates of 90-100%. Moreover, the stocks we have added to the CCP portfolio plug directly into macro tailwinds of private manufacturing capex pickup, organized healthcare penetration and rising demand for building materials.
Increasing allocation to ‘enterprising compounders’ in the CCP portfolio from <20% to more than 50%
While competitive advantages / moats define the quantum of cash generation of a business (measured by metrics such as ROCE or ROIC), reinvestment of this cash (i.e. capital allocation) defines the overall growth of the business. These capital allocation decisions can be in two mutually exclusive directions –
- Reinvestment in existing businesses (core business) to deepen and evolve its competitive advantages; and
- Reinvestment in new businesses to add new growth drivers.
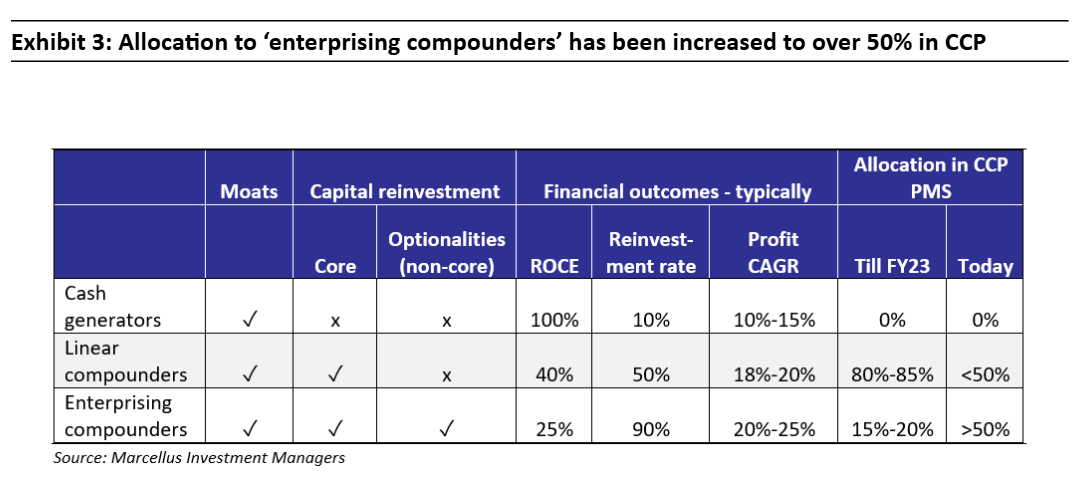
Based on the nature of their capital allocation decisions, businesses with strong competitive advantages or moats can be categorized into three distinct buckets –
Bucket 1 – ‘Cash generators’ with low reinvestment rates:
These businesses are highly cash generative, at times with ROCEs exceeding 100%! They do not reinvest capital meaningfully either because of fewer avenues of growth (restricted by high market share in a slow growth industry or by competition / disruption) or because of lethargy around capital allocation. Some of these businesses might be satisfied driving profit growth through operating efficiencies for a few years before this driver of growth also runs out of steam. Typical examples include the likes of Colgate Palmolive or Castrol. These businesses might offer great longevity, but are expected to deliver weak profit growth in the long term. We have always avoided exposure to such deeply moated companies with low capital reinvestment rates. Examples of these sorts of businesses would be Colgate-Palmolive and Castrol.
Bucket 2 – ‘Linear compounders’ – High reinvestment rate, predominantly focused towards driving growth in the core and peripheral businesses:
Moats of the core business for these companies are as strong as those in Bucket 1 (‘cash generators’). These companies deliver linear business progression with capital allocation in existing core products and services driving growth through market share gains, typically in an underpenetrated industry. New revenue growth initiatives for these businesses are in peripheral areas – i.e. products / geographies / customers very closely associated with the existing core business. Typically the reinvestment rate of such businesses hovers around 50% with ROCEs of 40%, thereby delivering around 20% CAGR in profits with a potential for good longevity. New disruptive businesses that are seeded by these companies would typically become meaningful in their size of profits only after another 5-7 years. Until FY23, over 80% of Marcellus’ CCP portfolio had been invested in such businesses (e.g. Asian Paints, HDFC Bank, Dr. Lal Pathlabs).
Bucket 3 – ‘Enterprising compounders’ – High reinvestment rate, significantly focused on addition of new growth drivers whilst also driving growth in their core businesses:
These companies actively and consistently pursue non-core capital allocation, in addition to the strong moats and prudent core capital allocation of companies in Bucket 2 (‘linear compounders’). These ‘enterprising compounders’ incubate or invest in new businesses initiatives which are reasonably unrelated to their existing core business. The new initiatives feed off some of the competitive advantages of the core business to build differentiation. Reinvestment rates of companies in bucket 3 are 90%-100% with ROCEs of 25% typically i.e. they reinvest almost entirely, the cash generated from their existing businesses. New business initiatives are pursued in a manner such that they become significant contributors to the consolidated financials of the Bucket 3 companies (‘enterprising compounders’) over no longer than a 3-5 year time horizon. As these new business initiatives scale up, they are likely to help sustain consolidated profit CAGR above 20% – closer to 25% typically. Till FY23, no more than 15%-20% of Marcellus’ CCP portfolio (e.g. Bajaj Finance, Titan) was allocated towards such companies.
Over the past 12 months, the allocation of Marcellus’ CCP to ‘enterprising compounders’ (Bucket 3) has been increased to well above 50%, thereby leading to a change in the weighted average ROCE and reinvestment rate of the CCP portfolio from 35%-40% ROCE and 50%-55% reinvestment rate previously, to 25-30% ROCE and 80% reinvestment rate now.
Why have we increased allocation of Bucket 3 (‘Enterprising Compounders’) at the expense of Bucket 2?
As highlighted in our blogs over the past year, the nature of the Indian economy has changed post-Covid. A combination of superior physical and digital infrastructure, the benefits of economic integration in the wake of GST and a structural drop of the cost of capital (as 100mn+ Indian families shifted their savings from physical to financial assets) resulted in two different effects kicking-in: (a) smaller companies started pushing aggressively into the territory hitherto dominated by larger players eg. Astral Poly entering the paints industry; and (b) well-managed large companies realised that it is time to spread their wings and enter new industries eg. Tube entering the EV space, Trent entering the value apparel space. Exhibit 1 from our 25th June blog “Creative Destruction on an Epic Scale in India Inc” explains these two effects in more detail – see the left hand column of the table below.
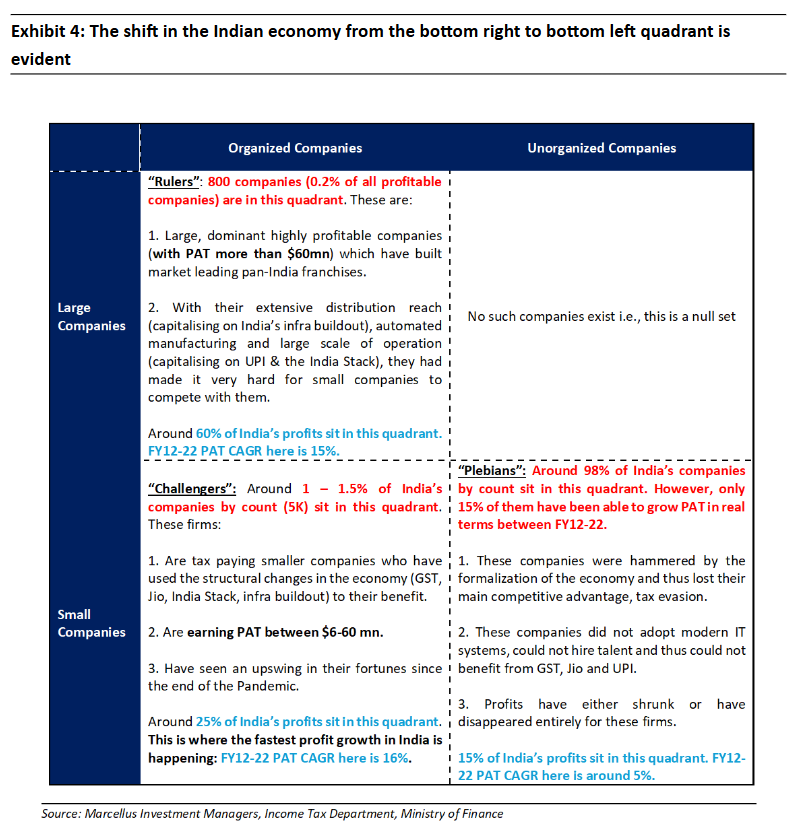
As we saw these changes take place in the Indian economy, we realised that by increasing allocation to ‘Enterprising Compounders’, CCP could benefit from the shape-shifting of the Indian economy.
Tube and Trent are examples of ‘Enterprising Compounders’ recently added to Marcellus’ CCP
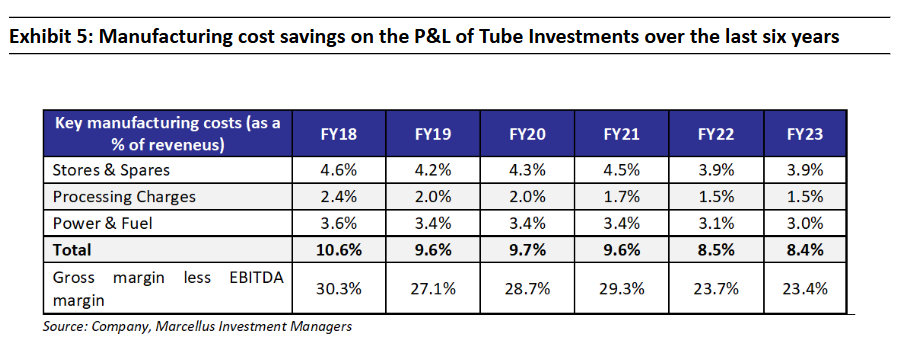
Tube Investment of India (TII): Tube’s core engineering business (TII’s standalone entity) has built competitive advantages in precision steel strips & tubes, automotive & industrial chains and car door frames. Over FY19-24, this core business delivered 19% CAGR in EBIT and 25% CAGR in PAT, with an ROCE/ROIC of 21%/25% respectively. This growth has been supported by the company’s strong focus on extracting operating efficiencies. TII has engaged Japanese consultants like Yasutoshi Washio and firms like Shingijutsu Consulting (founded by a member of the team that developed and implemented the Toyota Production System) to achieve Lean production through Kaizen (‘Continuous Improvement’). To maintain the persistence of these initiatives at TII, they have designated a senior employee at every plant as ‘Kaizen Promotion Officer (KPO)’ who is primarily responsible to drive the initiatives on the shop floor. One week in every two months is designated as ‘Kaizen Week’ where the consultants visit the plant and operational efficiency oriented projects are undertaken. One such example is ‘reduction in change-over time of tools’ – Each press in the manufacturing process on an average faces 3-4 changeovers per day. These changeovers need to be done as fast as possible to reduce the waiting period. The Tool-room acts as an ‘Operation Theatre’ here. In a recent project, TII reduced the change-over time of a tool from 45-minutes to 9 minutes. Such initiatives have already led to a substantial cost savings on the P&L – as highlighted in the table below. The Management has set a target of reaching 15% PBT margins (12.7% currently) over next five-to-six years of continuous implementation of Lean principles.
Over 80% of the cash flows generated by this standalone business of Tube over the last five years were reinvested to:
- Acquire 58% stake in CG Power – invested in it at the right time (financial distress due to governance challenges) and Mr. Natrajan Srinivasan, a former employee of the Murugappa group, was recalled from his retirement to turn the business around. Over the past five years, CG power’s operating profits have quadrupled and its operating cash flows are targeted towards both its core capex as well as incubation of new businesses such its recent foray into the Outsourced Semiconductor Assembly and Test (OSAT) facility in Gujarat.
- Incubate several new businesses such as commercial electric vehicles (3-wheelers, tractors, LCVs and MHCVs), CDMO (contract manufacturing for global big-pharma), optics (lenses for mobile phones and automotive and industrials purposes) etc. Some of these businesses have made a good start so far. For instance, within the electric 3-wheeler industry (which is already 12% of India’s overall 3-wheeler industry), in the five southern states (TN, KL, KA, AP and TS) Tube is the largest player controlling 26% market share in FY24 and 29% in Apr-May 2024. Benefitting from Chola’s CV finance business and hence superior understanding of different types of cargo movement across the fleet of 3Ws, Tube can segment their target customer base for more relevant product positioning. In heavy commercial vehicles, Tube has targeted a niche of point-to-point cargo movement to overcome the challenge of ‘range anxiety’ in prospective customers. It has sold 44 trucks so far and another 75-80 trucks are under trial with multiple potential customers. Similarly, in its CDMO business, trial shipments of their products have already commenced exports to some of the largest global pharma companies.
Combining Tube’s core cash generation with the investment value of its majority stake in CG Power and potential success of some (not necessarily all) of the several optionalities that have been incubated by the company, we expect investment returns from this stock to include benefits of both longevity and optionalities in cash flow compounding in future.
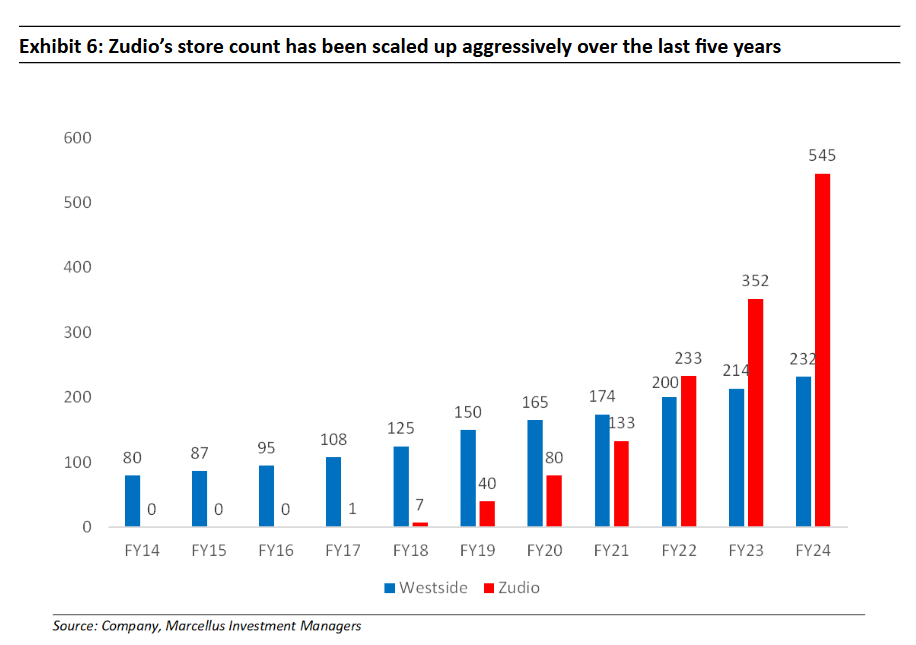
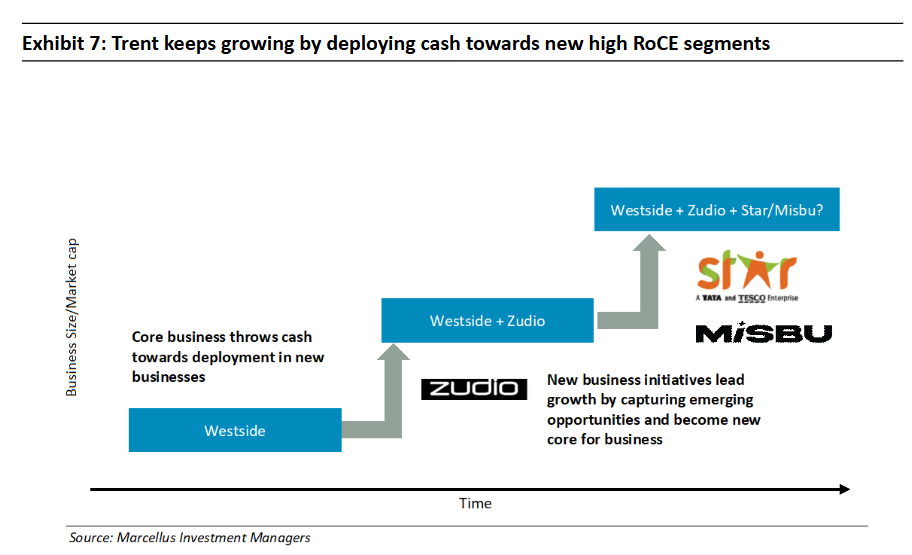
Trent: Trent’s core business for the last 25 years has been apparel retail under the format named ‘Westside’, which has grown its store count at ~12% CAGR, with an SSG (same store sales growth) of 8-10% annually and format level ROCE of over 30%. Westside’s moat has been built around product relevance, differentiated through quality, design and appropriate pricing. This allows Westside to maximize its “full priced” sales, hence reducing the need to liquidate unsold inventory through discounted sales at low profit margins. Such product differentiation is driven by deep understanding of customer requirements, high-quality in-house designers and an efficient store operating model (in-house supply chain, staff training, leasing structure, store location selection, look & feel etc). Additionally, quick refreshment rates (every 15 days or so) allows for low inventory levels in stores – leading to high Inventory turnover ratio. In other words, consistently relevant & differentiated product = less dead stock = less discounted sales & high inventory turnover = high store level ROCE and cash generation. After having incubated several new retail formats over the last 10-12 years, in 2019 Trent aggressively started scaling up Zudio as its second engine of growth (see exhibit below). Zudio’s store count has been scaled up at 60% CAGR over the last three years, with an SSG of 10-12% annually and format level ROCE of around 30%.
Cash generation and learnings from Westside and Zudio are being used to incubate several other retail formats at Trent. In fact Zudio took birth inside Trent’s grocery retail / supermarket format called ‘Star Bazaar’ (Star). Trent is now ready to scale up Star as its third growth engine, after having spent the best part of the last decade to stabilize its unit economics. Today, Star adds significantly more value to a customer compared to any of its competitors through a combination of –
- Fresh fruits and vegetables procured directly from farmers at Trent’s collection centres, delivered fresh daily in the morning with only 5% wastage through the day, offered at prices similar or lower than the nearby mandi – difficult for any competitor to build over a short period of time;
- Zudio’s apparel merchandise sold in Star stores – a superior apparel proposition compared to any of its competitors;
- Private label brands called Fabsta (packaged food), Klia (household care), Skye (personal care) and Smartle (consumer durables) offering over 600 SKUs with product quality for many of these SKUs being at par with established national brands from firms such as Nestle, Britannia, HUL; and
- 10-20% discount at MRP level on national brands’ FMCG products, matching the prices of competitors like D-Mart and Smart Bazaar (Reliance’s supermarket format).
Besides Star, Trent has incubated several other retail formats like Misbu (cosmetics), Samoh (apparel) and Utsa (apparel) – some of which might become future engines of growth.
Fundamentals of CCP Companies remain healthy and consistent
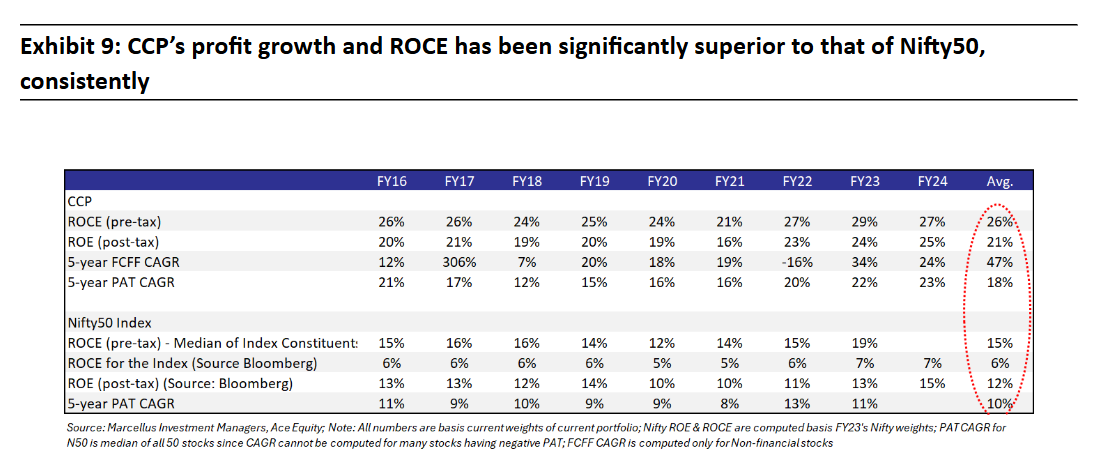
As highlighted in the table below, over FY19-23, our portfolio companies had delivered profit compounding of over 20% CAGR. On that base, FY24 saw over 30% YoY growth in profits with an ROCE of around 25%. It is worth reiterating that the weighted average reinvestment rate of capital (defined as operating cash flows less dividends) in this portfolio has increased from 50%-55% previously, to 75%-80% in the current portfolio. Furthermore, ROCE of the portfolio has dropped from 30%-35% previously to 25% for the current portfolio. These changes in financials of the portfolio constituents are due to greater allocation to ‘enterprising compounders’ compared to ‘linear compounders’, as defined in the previous section of this newsletter. As our portfolio companies benefit from their capital allocation decisions, and from the macro tailwinds in the industries in which they operate, we expect the profit growth of the CCP portfolio to be healthy and consistent going forward as well.
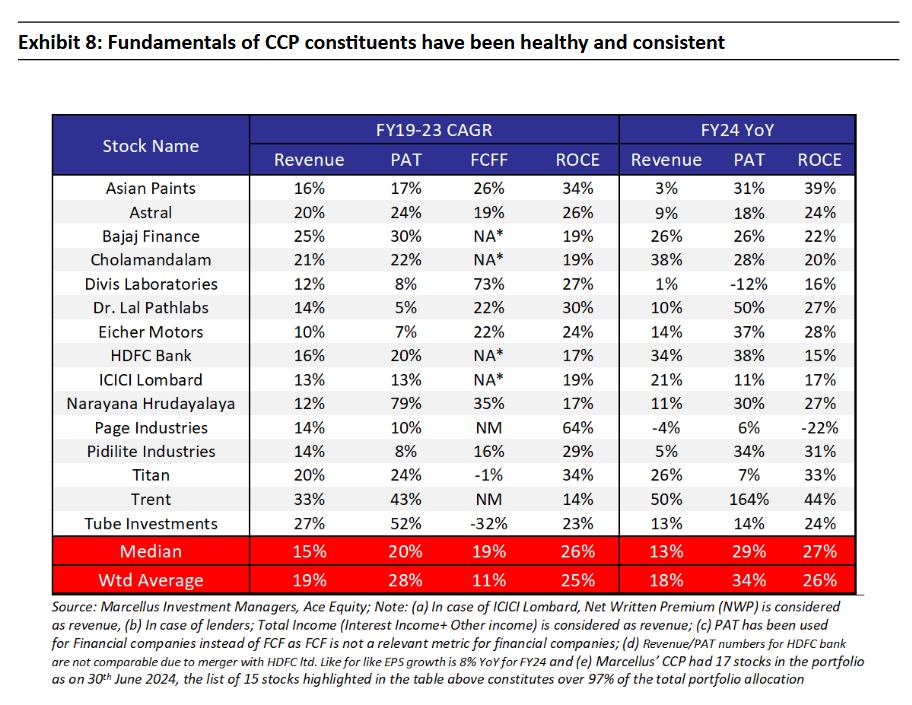
Historical fundamentals of CCP portfolio constituents are significantly superior to those of Nifty50 – weighted average ROCE of the portfolio is 4x that of Nifty50, and profit after tax compounding is 2x that of Nifty50.
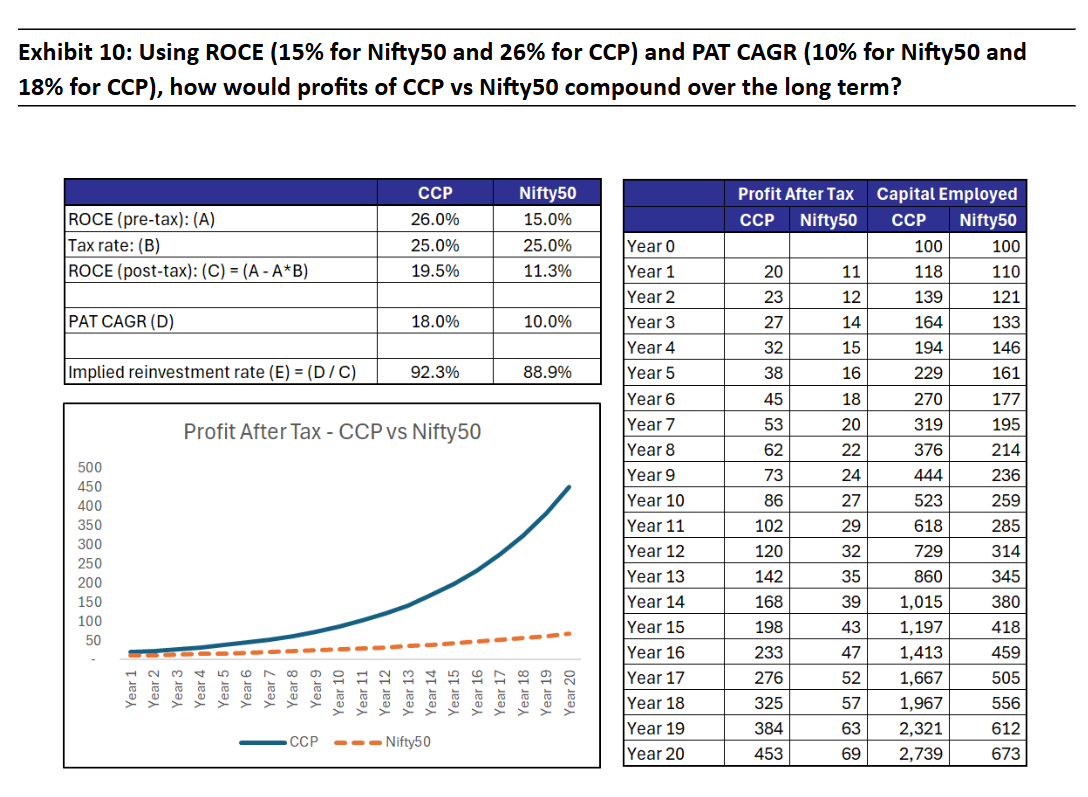
Such superior fundamentals relative to the index justify a correspondingly superior valuation relative to the index. Why? The share price of any asset should reflect the cash flows that the asset is likely to generate in future. On the same capital employed of say Rs 100, CCP portfolio companies generate significantly higher cash flows in a year, which through reinvestment, drives significantly higher profit growth in future, compared to Nifty50. As a result, the P/E multiple on today’s comparable profit base will deservedly be higher for CCP due to superior expected profit compounding in future vs that of the Nifty50 Index!
Below is a simple example of how profits of CCP companies are likely to compound vs those of Nifty50. Note that in this example, we have used 26% ROCE and 18% profit compounding for CCP based on their 10 year historical trajectory. However, we have used median (instead of weighted average) ROCE of 15% for the Nifty50 constituents because the weighted average ROCE of 6% that Nifty50 has historically had, cannot fund Nifty50’s profit compounding of 10% sustainably (without consistent increase in leverage).
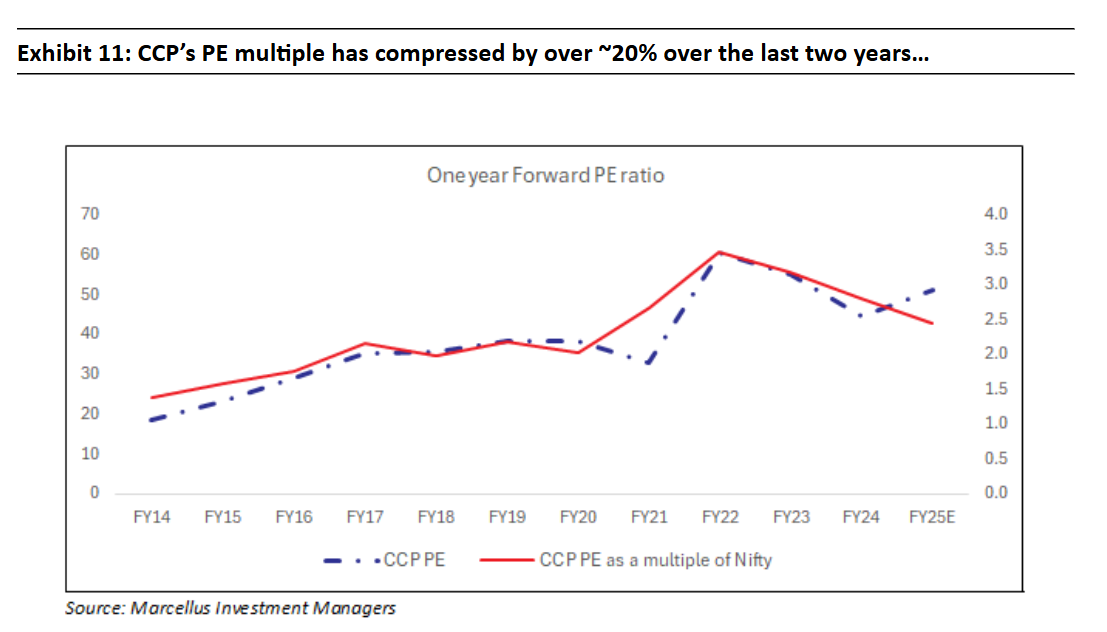
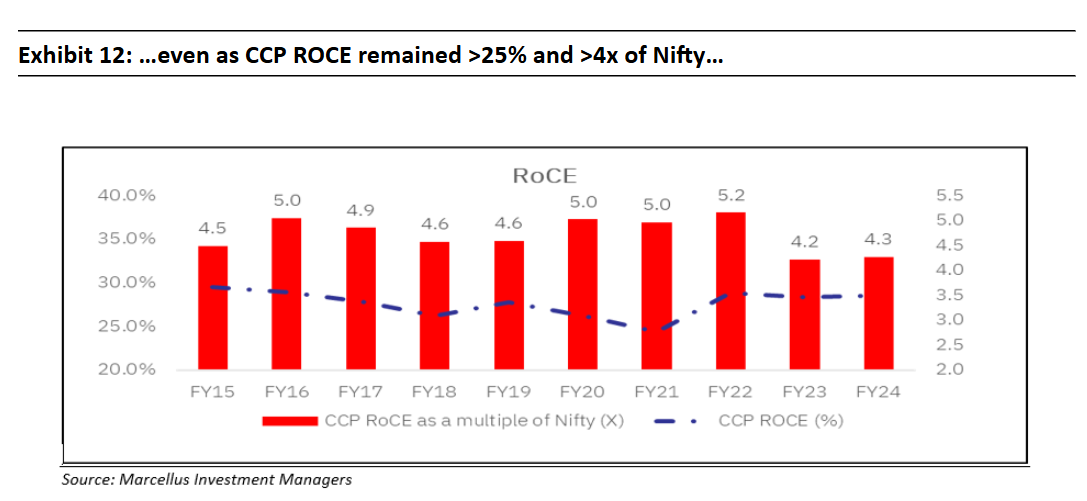
However, even though CCP’s ROCE has remained 4x higher than that of Nifty50 historically (see chart on the right below), the portfolio’s P/E multiple has compressed by over 20% over the last 2 years (from 45x to 35x), and its P/E multiple relative to Nifty50 has compressed by over 35% (from 2.8x to 1.8x) – see chart on the left below. Hence, we expect a massive catchup of valuations with the fundamentals in CCP, akin to the ‘phase 3’ time period highlighted in the Exhibit 2 above.
Regards,
Team Marcellus
If you want to read our other published material, please visit https://marcellus.in/

